A desktop application for spatial epidemiology. It geocodes case addresses, detects clusters in the resulting point data, and labels how precisely each address was matched, with the geocoder and the statistics running in-process.
Windows x64, macOS Apple silicon, Linux x64
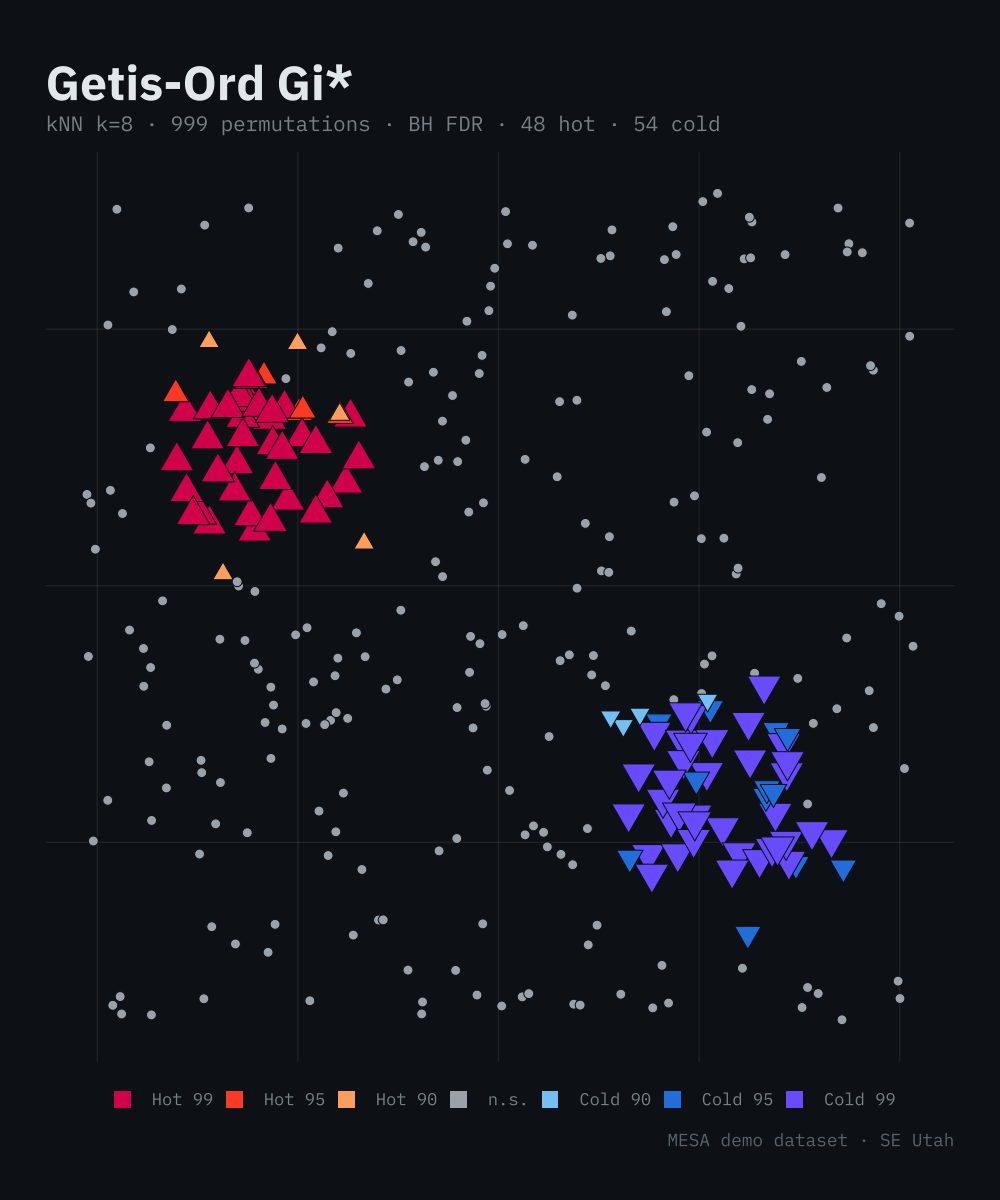
Figure 1. Getis-Ord Gi* on MESA's demo dataset.
Local hot- and cold-spot detection with Getis-Ord Gi* and a Bernoulli spatial scan, reported alongside a global Moran's I autocorrelation diagnostic. Inference is Monte-Carlo and reproduces bit-for-bit across platforms.
MESA builds a local SQLite address index that the geocoder matches against, for any US state, from the National Address Database (USDOT, public domain), downloaded directly from the source and never redistributed. Where a state has been prepared in advance, MESA downloads that database instead, which is about a tenth of the bytes and skips the build. You can also load your own locality's authoritative points, and optional supplemental files extend coverage.
A count small enough to identify someone must not be published, and masking that one cell is not enough: if the row total sits beside it, the hidden number can be subtracted back out. MESA masks a second value as cover and reports how many groups remain recoverable, which should be zero. The threshold is yours to set, because it is local policy rather than a default.
Counts become rates per 1,000 or per 100,000. Where a rate cannot honestly be made, the cell is left blank rather than zero, because a zero is a claim about a place. Empirical Bayes smoothing (Marshall, 1991) pulls a rate toward the district mean by an amount set by how little the local population can support, so one case among forty people stops being the loudest number on the map.
Steps are wired together on a canvas and saved with the project, so next month's report is a re-run rather than a rebuild. Each run records what it read, what it changed, and which settings produced the result.
Reads Cognos MHT, CSV, and Excel exports. Columns can be corrected, tables joined on shared keys, and results exported to CSV, Excel, or spatial formats.
MESA emits no telemetry and opens no outbound connections while analyzing.
The same geocoder can be exposed as a local ArcGIS GeocodeServer endpoint. ArcGIS Pro can batch-geocode tables against it directly, with no ArcGIS Enterprise and no tokens. It binds to localhost by default, so requests do not leave the machine.
A Cognos MHT, CSV, or Excel export is parsed and column-profiled, and missing fields are reported.
.mht, .csv, .xlsxThe address column is matched against the loaded authoritative address data. Each result carries a precision label.
operator-supplied authoritative dataGetis-Ord Gi* or a Bernoulli scan, with Monte-Carlo inference, identifies where cases aggregate into hot and cold spots.
Gi*, Bernoulli scanResults are written back to CSV, Excel, or a spatial format, precision labels included, for use in a downstream tool or a report.
.csv, .xlsx, spatialSpatial epidemiology usually means shipping addresses to a geocoding API. MESA doesn't. The address database lives on your disk and the analysis runs in-process, so you can work on an air-gapped machine and still get reproducible results. Every figure on this page, including the scan below, is real MESA output.
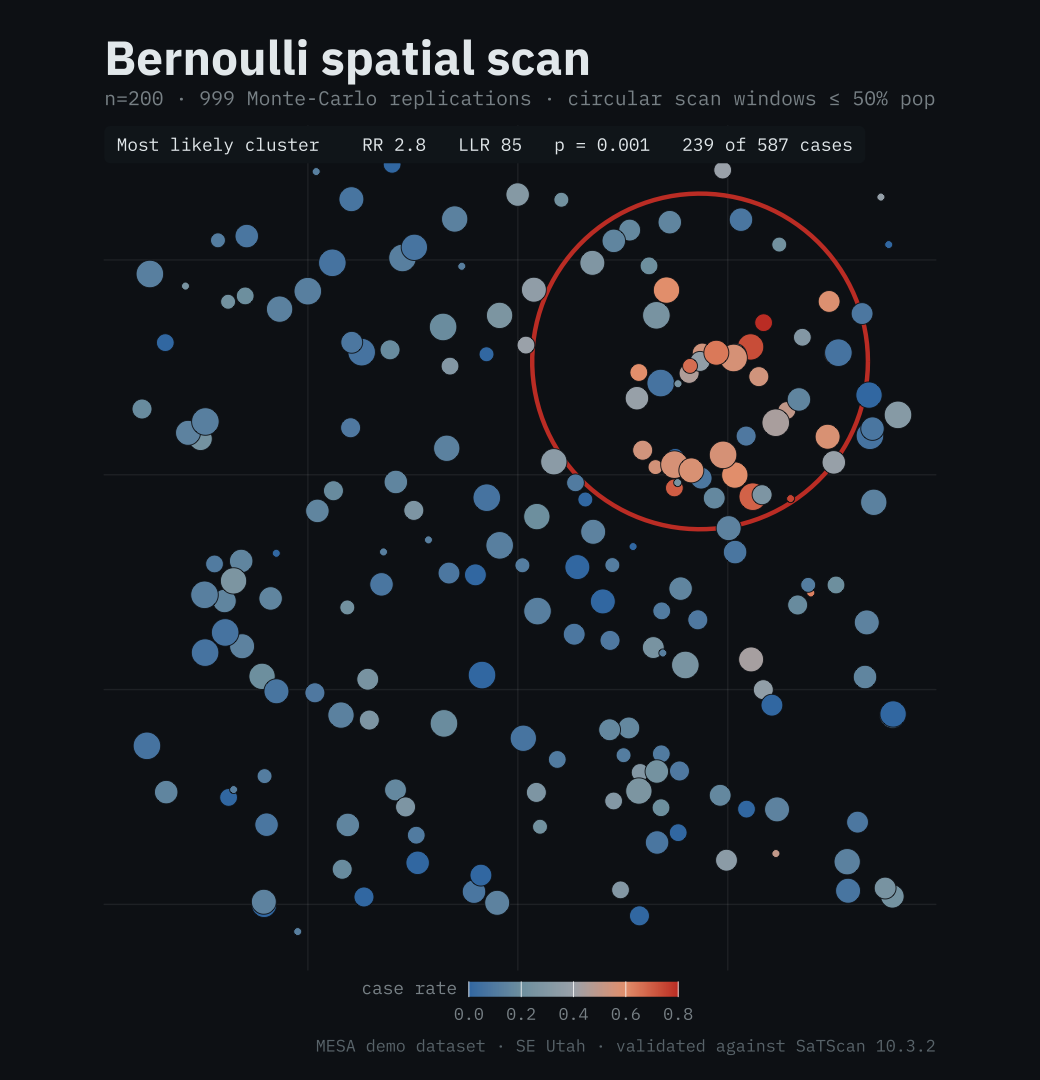
Figure 2. Bernoulli spatial scan on MESA's demo dataset, validated against SaTScan.
The geocoder matches against authoritative data, the statistics are checked against the standard reference implementations, and every run reproduces byte for byte.
| ≈ 98 million | US National Address Database points MESA builds from, per state |
| PySAL, R/spdep | Getis-Ord Gi*, Moran's I, and multiple-testing correction cross-checked against the standard libraries |
| SaTScan 10.3.2 | Bernoulli spatial scan matched against the field standard, no discrepancies in the suite |
| bit-identical | the same p-values on Windows, macOS, and Linux, from one core or a hundred |
| ≈ 0.05 | empirical false-positive rate at α = 0.05 under complete spatial randomness, so Type-I error tracks the nominal level (checked against 99.999% Wilson intervals) |
| > 90% | true-positive rate at large effect size for an injected hot spot; statistical power rises monotonically with effect size |
| 10−4 | Gi* z-scores match PySAL's esda.G_Local within this tolerance, and adjusted p-values within 10−3 |
MESA geocodes anywhere in the US, building a local database for any state from the National Address Database, and is validated nationwide with the adversarial harness below, across eight representative states of differing address styles and data quality.
| 98.8% | sensitivity across eight states built from the US National Address Database: the correct address point recovered under adversarial input noise |
| 95.0% | specificity: fabricated addresses correctly refused rather than snapped to a wrong, distant point, on the same adversarial controls |
The adversarial harness scores each match against the record's own authoritative coordinate, with fabricated negative controls and stratified bootstrap intervals; not a synthetic self-benchmark. The figures cover eight states (Alaska, Connecticut, DC, Delaware, Nebraska, Rhode Island, Wisconsin, Wyoming) built from the National Address Database; the scoring was fit on separate development data and applied unchanged, so these are held-out, out-of-distribution results. The specificity shown is the genuine wrong-street rate; the full per-state numbers, both raw and genuine, and the method are in the published validation data, which MESA refreshes as each National Address Database release is validated. Because the geocoder works against whatever authoritative data you load, results depend on that data's coverage and quality, which MESA reports per state before you download. Spatial-statistics cross-validation re-runs in CI against regenerated PySAL, R, and SciPy oracles.
Full methodology, parameters, and citations: geocoding, Gi* & Moran's I, Bernoulli scan, or the methods overview.
Actively developed: recent work adds k-neighborhood and correction-method sensitivity analysis, so a result can be checked against alternate specifications, plus further cross-platform reproducibility hardening.
Native builds for each platform. Every release is published with a SHA-256 checksum so you can verify it before running.
| platform | architecture | status | |
|---|---|---|---|
| Windows | x64, Windows 10/11, .exe | coming soon | Download |
| macOS | Apple silicon, arm64, .dmg | coming soon | Download |
| Linux | x64, AppImage | coming soon | Download |
Per-platform builds are still being set up; this table will show the current version and checksums once they are published. MESA is pre-release. For early access, contact ross@spatialepi.org.
MESA is developed by Ross Wardrup, an MPH Epidemiology candidate at the University of Memphis, with a background in geospatial software and public-health surveillance and an epidemiology practicum at the Southeast Utah Health Department. Publications: ORCID, Google Scholar, GitHub, LinkedIn
 MESA
MESA